

Uptime Kuma is a self-hosted monitoring service that monitors the availability of websites and services. In this article, I'll show you how you can integrate Uptime Kuma into Home Assistant, what functions it offers and how you can monitor a website with screenshots.
What is Uptime Kuma? 🤔
Uptime Kuma is a modern, user-friendly solution for monitoring the availability of websites, APIs and services. It offers:
- Monitoring of HTTP(s), TCP, Ping and DNS: Check the availability of various services.
- Notifications: Receive notifications via email, Telegram, Discord and many other services.
- Statistics and reports: Detailed reports on availability and response times.
- Self-hosted: Full control over your data and configurations.
 louislam
Installing Uptime Kuma with Docker 🐳
Installing Uptime Kuma is easy and is done via Docker. Here is a step-by-step guide:
Create a Docker-Compose file
Create a docker-compose.yml file with the following content:
version: '3'
services:
  uptime-kuma:
    image: louislam/uptime-kuma:1
    container_name: uptime-kuma
    ports:
      - "3001:3001"
    volumes:
      - uptime-kuma-data:/app/data
    restart: unless-stopped

volumes:
  uptime-kuma-data:
Start container
Execute the following commands to start the container:
mkdir uptime-kuma
cd uptime-kuma
nano docker-compose.yml
Insert the above content and save the file. Then start the container:
docker-compose up -dFunctions of Uptime Kuma 🌟
Uptime Kuma offers a variety of functions for monitoring your services:
- HTTP(s) Monitoring: Monitor the availability and response time of your websites.
- TCP Monitoring: Check the availability of TCP services.
- Ping Monitoring: Monitor latency times and availability through ping requests.
- DNS Monitoring: Check DNS servers and their response times.
Notifications
Uptime Kuma supports various notification services such as email, Telegram, Discord, Slack and many more. You will be notified immediately if a service is unavailable.
Detailed reports
Get detailed reports on the availability and response times of your services. Uptime Kuma provides clear dashboards and charts to help you analyze the performance of your services.
Monitoring a website: Step-by-step guide 📸
Here I'll show you how to add and monitor a website in Uptime Kuma.
Add new monitoring
Open the Uptime Kuma web interface and click on "Add monitor". Select the desired monitoring type (e.g. HTTP(s)).
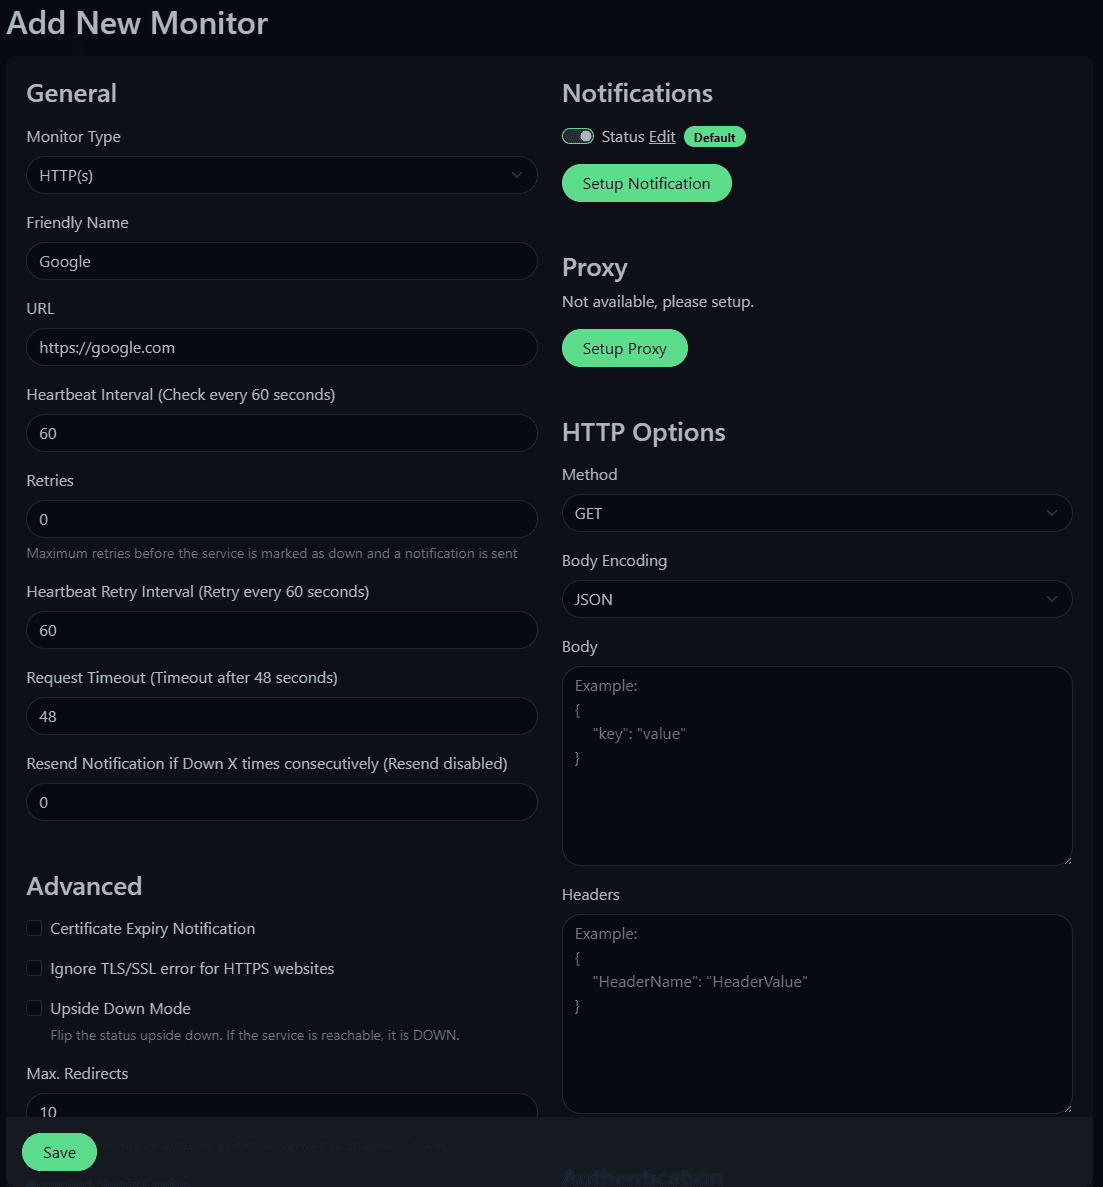
Make settings
Enter the URL of the website to be monitored and configure the other settings such as interval and notifications. An example of the input screen:
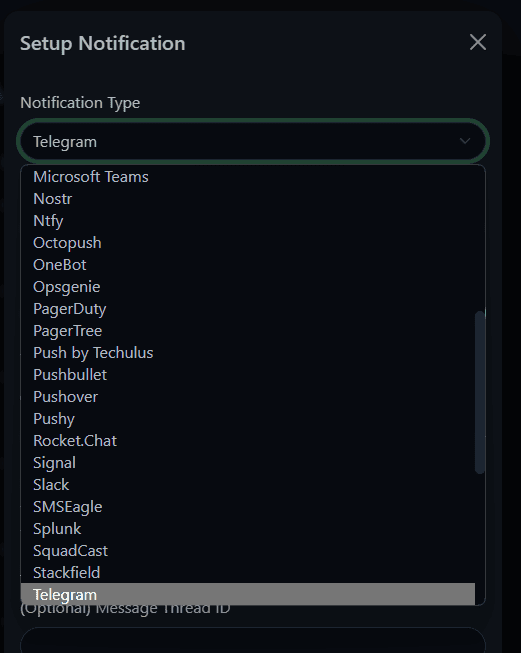
Enable monitoring
Save the settings and enable monitoring. Uptime Kuma will now start to check the website regularly and send notifications if the site is unavailable. You are completely free with the notifications and can use more than one here:
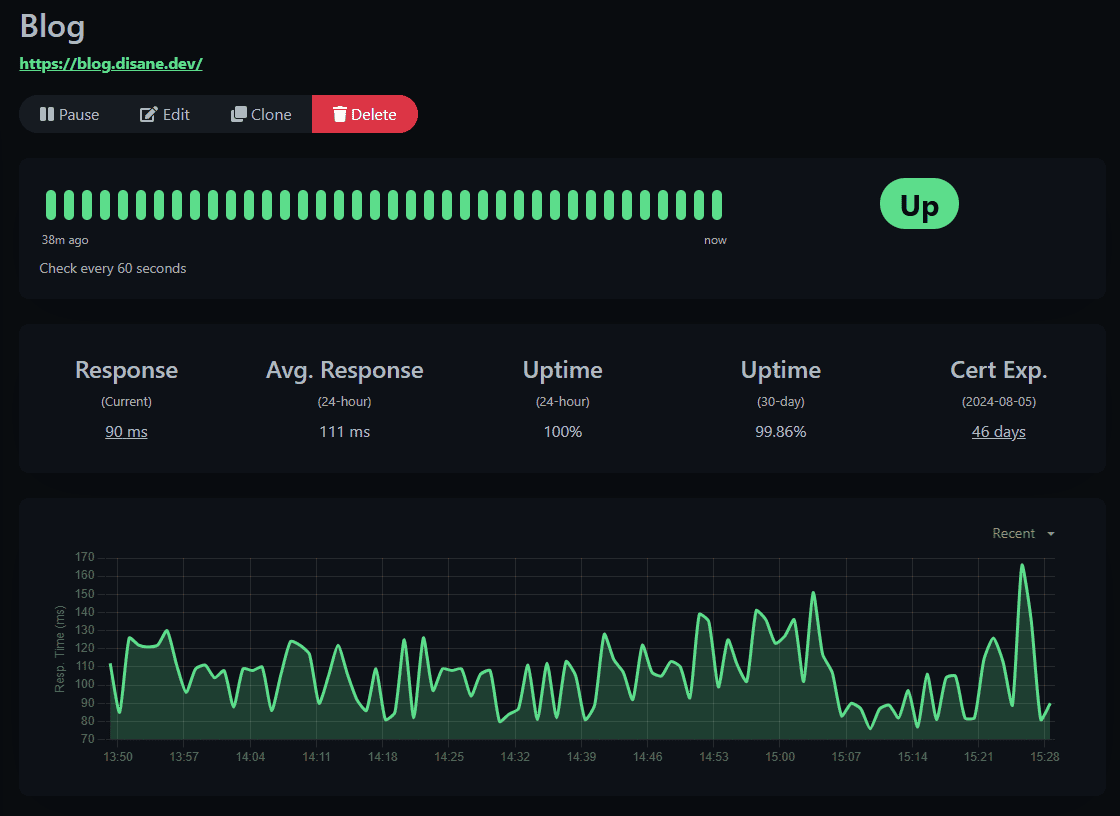
Reports and statistics
In the overview, you can now see the availability and response times of the monitored website. Here, for example, for this blog:
Integration in Home Assistant 🏠
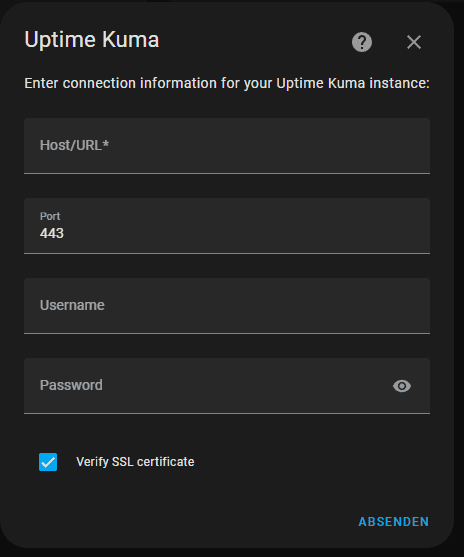
To integrate Uptime Kuma in Home Assistant, use the integration available via HACS.
meichthysIn the setup you then enter an IP, the port, username and password of your user.
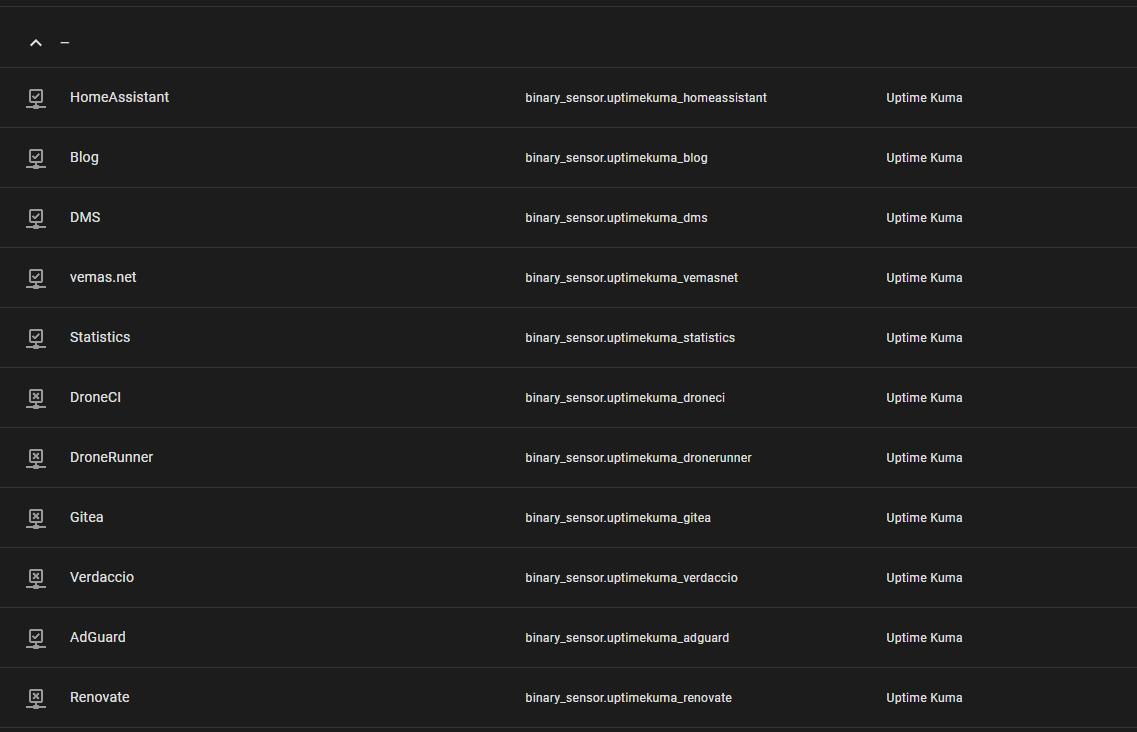
Once you have done this, you have also directly integrated all sensors into HomeAssistant:
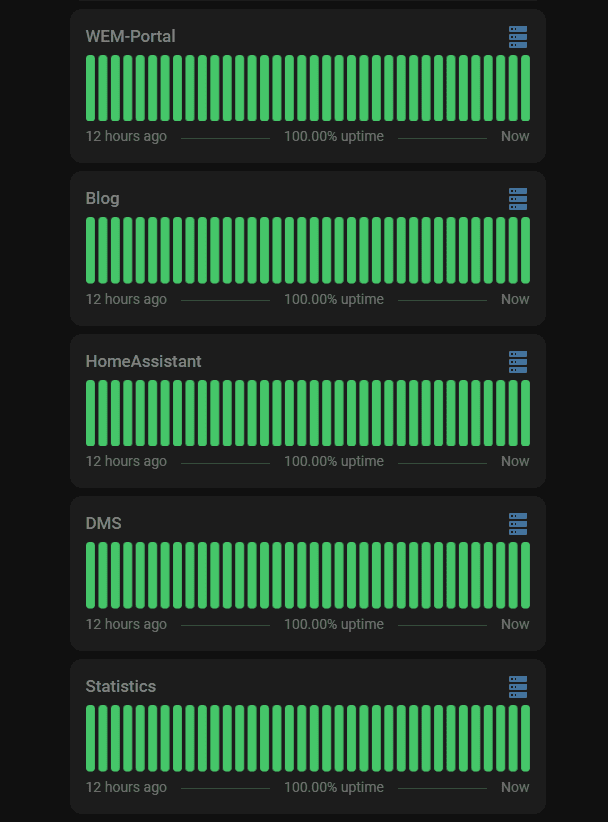
With the help of the uptime-card you can also use it to create beautiful dashboards.
dylandoamaralTogether with auto-entities, you can even build a completely dynamic dashboard that automatically displays all sensors:
type: custom:auto-entities
filter:
  include:
    - entity_id: binary_sensor.uptime*
  exclude: []
sort:
  method: state
  reverse: true
card:
  type: custom:easy-layout-card
  layout_type: vertical
  cards:
    type: custom:config-template-card
    entities:
      - this.entity_id
    card:
      type: custom:uptime-card
      entity: this.entity_id
      ok: 'on'
      ko: 'off'
      update_interval: 30
      icon: mdi:server
      ko_icon: mdi:server-off
      status_adaptive_color: true
      alias:
        ok: Up
        ko: Down
      hours_to_show: 12
      icon_adaptive_color: false
      average_template: '[[[ return variables.uptime.toFixed(2); ]]]% uptime'
      bar:
        spacing: 4
        height: 75
        round: 4
      show:
        average: true
        status: false
      alignment:
        status: spaced
        header: spaced
        icon_first: false
      tap_action:
        action: url
        url_path: '{{ state_attr(this.entity_id, ''monitor_url'') }}'
      init:
        - animation: reveal
      blink:
        target: status
        effect: fade
        speed: 10
The dashboard or card could then look like this:
Conclusion 🎉
Uptime Kuma is a powerful and easy-to-use solution for monitoring the availability of your services. With easy integration into Home Assistant and extensive features, it's a must-have tool for anyone who wants to keep an eye on their web services. I use it myself to monitor a service and am more than satisfied.
Discover more articles

Uptime Kuma: Uptime von Services beobachten und tracken 🔎
Erfahre, wie Du Uptime Kuma installierst, in Home Assistant integrierst und Webseiten aktiv überwachst! 🔔

Docker: Einfache Bereitstellung von Diensten 🚢
Docker revolutioniert die Dienstbereitstellung durch Containerisierung. Erfahre, wie Docker die Tech-Branche beeinflusst und welche Vorteile es bietet! 🚀